Introduction
In what follows I present a theory developed by Robert Phair that might explain the molecular basis of ME/CFS and also open the door to a diagnostic test and to effective treatments. I will use some slides from the lecture that Phair gave during the Second Annual Community Symposium, a high profile scientific conference held some days ago at Stanford, sponsored by the Open Medicine Foundation. You can follow Phair’s lecture here, from 6:42:50. I will also present a mechanical analogy (what I mean will be quite clear when you go through the article) in order to hopefully describe Phair’s hypothesis in a very intuitive and immediate way. But the first thing to point out here is probably that this model might only be a beautiful, very elegant theory that will turn out to be wrong. Just keep in mind what Ronald Davis said, referring to Phair’s hypothesis, at the end of the symposium: “What usually happens when you do science is that you just show that yourself are wrong. That’s what science is all about: it’s a constant disappointment.”
Tryptophan has two fates
In order to understand the model proposed by Robert Phair, we first have to learn something about the metabolic pathways involved (figure 1). Tryptophan (Trp) is one of the nine essential amino acids, which means that we can’t synthesize it and thus it must be supplied in our diet [Salway JG. 2004]. Trp is metabolized in two alternative ways: one leads to serotonin and melatonin (upper half of figure 2), the other one (called kynurenine pathway) provides precursors for the biosynthesis of NAD+ and it also provides metabolites that induce immune suppression and promote immune tolerance between commensal microbiota and the host (lower half of figure 1), as reviewed here: [Mehraj V. et Routy JP. 2015].

The kynurenine pathway starts with the production of kynurenine from Trp, and this reaction is regulated by three enzymes in human beings: indoleamine-2,3-dioxygenase that is present in two isoforms, IDO-1 and IDO-2, and tryptophan 2,3-dioxygenase (TDO) [Salway JG. 2004]. IDO-1 is expressed in various tissues [R], whereas IDO2 is expressed only in a subset of these, namely the liver, kidney, antigen-presenting cells, brain, and placenta [Metz R. et al. 2007], [Witkiewicz AK. et al. 2009]. TDO, on the other hand, exerts the majority of its activity in the liver [R].
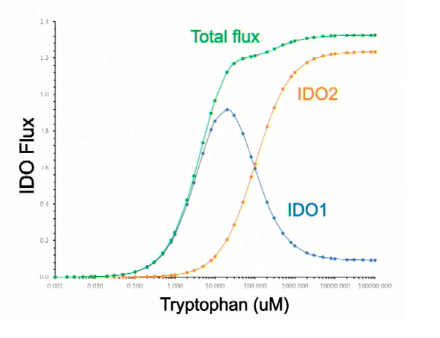
We have known for decades that the rate of tryptophan degradation by IDO-1 decreases at higher concentrations of Trp [Yamamoto S. et Hayaishi O. 1967], [Sono M. et al. 1980] and it has been hypothesized that the inhibition of IDO-1 at high concentrations is due to the fact that Trp binds the enzyme before O2 (at low concentration the order of binding is reversed) [Efimov I et al. 2012]. It has also been found that IDO-2 is less active than IDO-1 at low concentrations of Trp and that it follows a classic Michaelis–Menten kinetics [Meininger D. et al. 2011]. Robert Phair has collected these kinetic data on IDO-1 and IDO-2 in a beautiful diagram, presented during the symposium (figure 2) where he shows how IDO-1 is more active than IDO-2 at low concentration of Trp, while IDO-2 activity increases substantially at concentrations of the substrate above 10 µM.
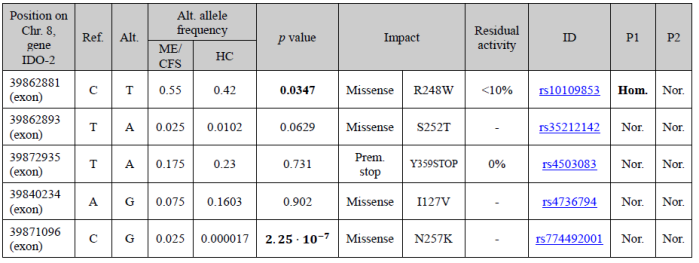
Damaging mutations of IDO-2 are quite common and as many as 50% of individuals of European or Asian descent and 25% of individuals of African descent may lack functional IDO2 alleles. Two such very well-known mutations are R248W, which reduces IDO-2 catalytic activity to less than 10%, and Y359STOP, which is associated with no activity at all [Metz R. et al. 2007]. Robert Phair has found that two of these single nucleotide polymorphisms (SNPs) are more common in his cohort of very severe ME/CFS patients than in the general population (see Table 1) and that, on average, severely ill ME/CFS patients have 1.7 non-fully functional IDO-2 alleles.

What happens if IDO-2 doesn’t work?
What happens when IDO-2 activity is widely reduced is clearly exemplified by another of Phair’s diagrams (figure 3): as you can see, for Trp concentration above 10 µM there is a reduction of the total velocity of Trp degradation, due to the lack of IDO-2 activity; from this point on, the higher the concentration of the substrate, the lower the ability of the system to get rid of it. This means that if – for any reason – Trp concentration in cytoplasm increases at a very high level, then it is impossible to come back to a normal value of Trp concentration. In other words, low IDO-2 activity (due to damaging mutations) coupled with high Trp concentrations, opens the door to a pathological steady state. According to Robert Phair, this steady state is what we call ME/CFS.
A mechanical analogy
It often happens that completely unrelated phenomena are ruled by the same equations. For instance, many mechanical systems can be described through electrical networks, leading to an easier understanding and handling of these systems. In this case, I searched for a mechanical system that could be equivalent, from a mathematical standpoint, to the metabolic pathway in which Trp is degraded by IDO-1 and IDO-2 when IDO-2 is broken; and which could be easy to understand. I describe such a model in Figure 4, where a ball with a mass m is subjected to the gravitational acceleration g and to a force F, that pushes it up a slope with a very precise shape. In this analogy, we have that the gravitational potential of the ball represents Trp concentration in the cytoplasm, the weight W of the ball multiplied by sinθ is the velocity of Trp degradation by IDO-1 and IDO-2 (IDO total flux), and F is the Trp influx in the cytoplasm, from the blood. When the ball is put in the green region of the slope, it remains in the green region, since the gravitational field pulls it down to a lower height; on the other hand, if the ball is put in the orange region, the force F pushes the ball to a higher altitude, away from the green area.

This is the exact behavior of the metabolic pathway we are talking about, when IDO-2 is broken: if Trp concentration is below a certain level, the system can maintain stable this concentration or to reduce it (green region); when the concentration is above this limit value, it can only increase further or remain stable (orange region). This is the “metabolic trap hypothesis“.
The good news
If this model was true, for at least a subgroup of patients, it would be very good news. Why? Well, if you look at the mechanical analogy you realize in just a glance that the pathological state has the potential to be reversed quite easily: you just need to reduce F, the influx of Trp from the blood. Since Trp comes from what we eat, it is theoretically possible to modulate its level with a dietary intervention. Other avenues are also possible; in fact, the system can go back to normal by increasing the value of θ, which represents IDO activity in our analogy, and IDO activity is strongly induced by INF-γ [Werner ER. et al. 1987]. But I won’t go further into that and I would rather like to mention what Ron Davis said during the symposium about treatments: “This is a dangerous pathway to experiment on… We are urging people to not experiment with this pathway. Give us some time to figure it out.”

Searching for experimental confirmation of the model
Phair was able to build a mathematical model of the pathways involved (this is what he does for a living, by the way), so he simulated the metabolic consequences of high Trp concentration in the blood when IDO-2 is broken, in silico. As you can see in Figure 5, the starting of the disease state requires two months of high blood Trp concentration which leads to high intracellular Trp concentration (B), low intracellular kynurenine (C), and impaired IDO activity (D). Note that after the initial increase in blood Trp, the amino acid concentration in blood comes back normal (A), so it can’t be used to measure this metabolic abnormality. The OMF funded a team of scientists in order to search for experimental confirmation of these predictions, which includes Ron Davis, Julie Wilhelmy, Curt Fischer, and Sundari Suresh. They have studied only 6 patients, so far, and they have found that in fact kynurenine concentration within cells is significantly reduced in patients vs controls and IDO flux is also reduced; at the same time, Trp concentration is increased in cells from ME/CFS patients, but not in a statistically significant fashion. Phair hopes that as the number of patients increases, this increase in Trp will reach statistical significance. Interestingly enough, urine analyses of three ME/CFS patients that I have collected myself, show low kynurenic acid and quinolinic acid, two metabolites that belong to the kynurenine pathway.
Does the hypothesis explain the clinical picture and available data?
This model predicts a disruption of serotonin metabolism, with an increase in serotonin synthesis and thus a possible down-regulation of post-synaptic serotonin receptors. Serotonin is involved in many functions of the brain and it is probably little known that this neurotransmitter plays a key role in systemic blood pressure control [Watts SW. et al. 2012]. Thus, an abnormality in this system could explain orthostatic intolerance, which is a common clinical feature of ME/CFS. Melatonin, the “sleep hormone”, and its receptors could also be negatively affected by this metabolic switch, and this could explain the sleep disturbances present in this patient population.
The reduction of kynurenine predicted by the hypothesis, on the other hand, could lead to reduced synthesis of nicotinamide adenine dinucleotide (NAD+), which is the end product of the kynurenine pathway and, as Ron Davis mentioned during the symposium, NAD+ is involved in 400 reactions in our cells. Among them, are the transport of electrons from the Krebs cycle to the electron transport chain and the conversion of pyruvate to acetyl CoA by pyruvate dehydrogenase [Salway JG. 2004], just to mention two of them (figure 1). We know from several studies that the Krebs cycle seems to be affected [Yamano E, et al. 2016] and that pyruvate dehydrogenase appears to be inhibited in ME/CFS [Fluge Ø. et al. 2016].
As if this was not enough, IDO activity is involved in the regulation of the immune system: metabolites of the kynurenine pathway (like kynurenine itself) are thought to block T-cell activation and trigger T-cell apoptosis, while also promoting Tregs [R]. It has been shown, for instance, that administration of an inhibitor of IDO can exacerbate symptoms of the murine model of multiple sclerosis [Sakurai K. et al. 2002] and of T-mediated ulcerative colitis [Gurtner GJ. et al. 2003] just to mention two experimental results. You might remember that T cell clonal expansion has been recently reported in ME/CFS by Mark Davis, and I have reviewed these results here. So one possible avenue is that low kynurenine might be the real cause of T cell dysregulation in ME/CFS as well as in other immune diseases (Ron Davis mentioned multiple sclerosis).
Recently kynurenine and IDO activity have also been implicated in the regulation of the state of immune tolerance between commensal microbiota and the host [Zelante T. et al. 2014] and, as the reader knows, reduced microbiota diversity and leaky gut have been consistently reported in ME/CFS [Frémont M et al. 2013], [Giloteaux L et al. 2016].
Thus it appears that if this model was true, kynurenine modulation could correct both the metabolic and the immunologic abnormalities reported in ME/CFS, and maybe also the alterations in gut microbiota. It is encouraging to know that kynurenine will be tested in ME/CFS patients by Johnas Blomberg, as Ron Davis mentioned during the symposium (at 7:17:50).
High prevalence, low penetrance
The reader might be disappointed to discover that, according to Phair’s hypothesis, the genetic predisposition to ME/CFS is so widespread in the general population. Why did Phair search for very common mutations, if the disease has a prevalence of about 0.4%? Well, Phair had to find a model that could explain also the epidemic episodes of the disease. If there was a genetic predisposition to ME/CFS – he reasoned – it would be common, very prevalent in the general population, otherwise we could not explain the epidemic episodes of the disease, like the one that happened in Lake Tahoe (Nevada), or in Lyndonville (New York), or in Bergen (Norway), and so forth: in some of these tragic events, up to 25% of the population developed ME/CFS. I wrote a note on that, some months ago, here. This seems reasonable; but how can a genetic predisposition so prevalent lead to the disease in only a small subgroup of those who carry it? The answer to that question is in Figures 4 and 5: you need a very high level of tryptophan to fall into the trap, and it has to last for two months. This probably happens in rare circumstances and thus this very prevalent genetic predisposition has low penetrance: the chance that it will lead to full-blown ME/CFS is low.

Any thoughts on the following comment posted on PR about the values used in the model and if they appear correct or not?
https://forums.phoenixrising.me/index.php?threads/community-symposium-on-molecular-basis-of-me-cfs-at-stanford-discussion-thread.61590/page-18#post-1004264
LikeLike
I had my genes sequenced at Genos, the lab Dr Phair prefers. I see no entry for IDO1 or IDO2, if I looked properly at the data. Does that mean this metabolic trap theory does not apply to me?
LikeLike
Sorry, it seems IDO1 is not a gene. Do you know what I should look for in my results to see if this theory may be relevant to my case? Thanks.
LikeLike
What kind of method are you using to navigate through your genetic data? You have to look for the mutations collected in table 1. They are missense mutations within the gene IDO-2.
LikeLike
According to the Michaelis–Menten curve presented by Phair for IDO-2 we have a K_M of about 100.000 microM. I don’t know how nandixon got a K-M of 200 microM. As for the articles mentioned, I haven’t read them yet: brain fog, you know…
LikeLiked by 1 person
Just to be clear, does 100.000 = one hundred thousand?
It’s notable that on Phair’s x-axis the resolution is too low to see if we are looking at a comma or a decimal point or a space.
I’m finding it hard to interpret that x axis.
Does it start at 1 or at 0.001? If it starts at 0.001, is there a discontinuity in the axis, because it jumps up from 0 100 to 1 000 and that tempts me to interpret it as going from zero-point-one to one thousand, which is not what a log scale should do!
Grazie mille!
LikeLiked by 1 person
Thank you thomasthethinkengine for this comment.
So, it seems that I have misread the chart. It starts at 0,001 and it is a logarithmic scale. This means that the K_M of IDO-2, according to figure 2, is 100 microM or so.
LikeLike
Paolo, non potresti pubblicare anche in italiano? Post come questo sono un po’ difficili
LikeLiked by 1 person
Ciao realtebo! Sto scrivendo la traduzione in italiano. 🙂
LikeLike
Has there been any more updates on this theory in recent times?
LikeLiked by 1 person
They are testing the theory experimentally. They had several problems because they have to measure metabolites within the cells and this trap seems to be present only in a subset of white blood cells.
LikeLike
Hm that is interesting, now the million dollar question. Could white blood cells in this trap send off exosomes which are down regulating the entire system….
LikeLiked by 1 person
I think that this could be a reasonable hypothesis, one among many.
LikeLike
I think genetics make people vulnerable. but a dysbiotic gut is what “pulls the trigger”.
LikeLike
Paolo
Che ne è stato del test universale?
LikeLike
Ti riferisci a quello descritto nel post seguente? https://paolomaccallini.com/2018/10/11/mark-davis-e-il-test-immunitario-universale-2/
LikeLike
Paolo, would it help if people ate a diet low in tryptophan?
LikeLike
Tryptophan comes from what you eat. So, diet might have an impact.
LikeLike
I had joint pain for a decade, then went vegan for 6 months, my joint pain disappeared, felt terrific for a year. Moved into a moldy condo and all hell broke loose..
I’d thought it was glutamate causing the issues…and wonder if resolving CDR would help?
LikeLike
I’d love to know if this triggers cell danger response, as formulated by Dr Robert Naviaux?
LikeLike
I think that CDR and the metabolic trap hypothesis do not have an obvious link.
LikeLike