Abstract
In this document, I compare data from two COVID vaccine trials carried out in South Africa (the Ubuntu trial and the Sisonke sub-study). Both trials were conducted on unvaccinated subjects, asymptomatic at the time of enrollment. Among them, some were found positive to SARS-CoV-2, but while the variant was identified as Delta in the Sisonke sub-study, the Omicron variant was reported in asymptomatic subjects of the Ubuntu trial. By considering the proportion of SARS-CoV-2 positive subjects in these two populations, the average number of daily confirmed cases, and the percentage of unvaccinated South African citizens at the respective times of enrollment of the two trials, I calculated the proportion of asymptomatic infections for Omicron, as a function of the same parameter for the Delta variant. I found that if we accept a proportion of asymptomatic infections of 17% for Delta, then we conclude that about 60% of all Omicron cases are asymptomatic, in unvaccinated subjects. This points towards significantly lower pathogenicity for the Omicron variant when compared to the Delta variant.
Introduction
The B.1.1.529 (Omicron) SARS-CoV-2 variant was first identified in Botswana and South Africa and was classified by WHO as a variant of concern (VOC) on 26 November 2021 (WHO website). As of 15 December 2021, the Omicron variant had already spread in 77 countries (especially in the United Kingdom, South Africa, and the United States) (Thakur V, Ratho RK, 2021). Omicron is characterized by a large number of mutations and deletions that seem to give it increased antibody escape capacity and enhanced transmissibility (Miller NL et al 2021). Yet, if we look at the number of deaths in South Africa (R), we note that despite a rapid increase in confirmed cases (most Omicron), it doesn’t follow the usual consequent increase (with a phase shift of two weeks). This suggests that Omicron is less dangerous than Delta, also considering that previous infection with Delta does not seem to protect against infection with Omicron (Garret N et al 2021) and that only 30% of the population of South Africa received at least one dose of vaccine (R).
In what follows I present a quantitative method for the comparison between the effect of Omicron and Delta on unvaccinated subjects. In particular, I calculate the ratio between asymptomatic SARS-CoV-2+ subjects and total SARS-CoV-2+ subjects for Omicron (


Results
The function 


Methods
Let 


| The number of carriers of the virus who did not receive the vaccine. |
| The number of asymptomatic individuals who did not receive the vaccine. Their positivity to the virus is not specified. |
| The ratio between the asymptomatic carriers of the virus who are unvaccinated and . |
 | The number of asymptomatic carriers of the virus who did not receive the vaccine. |
Between December 2 and December 17, 2021, a total of 330 asymptomatic subjects from South Africa were enrolled in a phase III clinical trial (Ubuntu trial, PACTR202105817814362) to assess the relative efficacy of the COVID-19 vaccine mRNA-1273 (MODERNA). This population is exclusively made up of individuals who had not been previously exposed to any COVID-19 vaccine. This population included persons living with HIV (PLWH) with a median age of 39 years (18-76). Among them, 230 individuals were tested for SARS-CoV-2 by RT-PCR and 31% (71 subjects) turned out to be positive. Among them, 56 samples were successfully subjected to further investigations: all had S gene dropout, suggestive of Omicron infection (Garret N et al 2021). It is worth mentioning that positivity to Omicron does not correlate with previous exposure to SARS-CoV-2, in this population: in other words, previous exposure to other SARS-CoV-2 variants does not protect against Omicron. Positivity to Omicron does not correlate with CD4+ cell count in PLWH either, so it seems that HIV does not interfere with

where 

Another study carried out in South Africa between June and August 2021 during the Delta outbreak (Sisonke sub-study, NCT04838795) reported a percentage of asymptomatic carriers of 2.4% (39/1604) among unvaccinated subjects (Garret N et al 2021). The average number of daily reported cases, in this case, is 12181; hence we have
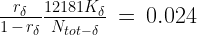
These last two equations give

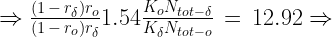
We are here considering unvaccinated subjects, but while in the period December 2-17 (Omicron outbreak) the percentage of subjects who received at least one dose of vaccine was on average 30.65%, in the time frame June-August (Delta outbreak), the same percentage was only 10.65% (remember that in both cases we consider subjects from South Africa) (R). Then we must assume that 
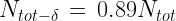

This means that
Note that we are here considering only unvaccinated subjects, while the number of reported cases includes both vaccinated and unvaccinated individuals. This means that 

where we assumed that k is the error (underestimation) made in measuring positive cases, which is the same in both cases since it depends on the efficiency of the health care system, on the behavior of the population, and other factors that do not change; while 


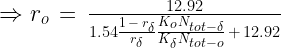
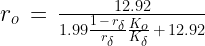
All that said, we can now express
% file name = omicron
% date of creation = 2/01/2022
clear all
close all
% the array of r_delta
steps = 100;
r_delta(1) = 0;
r_delta(steps) = 1;
inc = ( r_delta(100) - r_delta(1) )/(steps-1)
for i = 2:steps-1
  r_delta(i) = r_delta(i-1) + inc;
endfor
% the array of r_omicron
for i=1:steps
  ratio_r = (1 - r_delta(i))/r_delta(i);
  ratio_k = 0.78;
  r_omicron (i) = 12.92/((1.99*ratio_r*ratio_k) + 12.92);
  ratio_k = 1.;
  r_omicron2 (i) = 12.92/((1.99*ratio_r*ratio_k) + 12.92);
endfor
% plotting
plot (r_delta, r_omicron, '-k', "linewidth", 1)
hold on
plot (r_delta, r_omicron2, '--k', "linewidth", 1)
ylabel('r_{o} = (asymptomatic AND positive)/positive (Omicron)','fontsize',15);
xlabel('r_{\delta} = (asymptomatic AND positive)/positive (Delta)','fontsize',15);
axis equal;
axis([0,r_delta(steps),0,r_omicron2(steps)])
grid on
grid minor
legend ('k_{0}/k_{\delta} = 0.78', 'k_{0}/k_{\delta}  = 1', 'location', "northwest", 'fontsize', 15);
Limitations
The main limitation of this method is the fact that the characteristics of the two populations considered (the one from the Ubuntu trial and the one from the Sisonke sub-study) were not taken into account, so we can’t say whether these two populations are comparable with respect to variables such as age, comorbidities, and previous SARS-CoV-2 infection. We don’t know how well these two populations represent the general population either.
Further comments and conclusions
From the present analysis, the Omicron variant shows a higher relative number of asymptomatic cases, when compared to the Delta variant, in unvaccinated subjects. This points towards lower pathogenicity for the new variant.
In Italy, as of 31 December 2021, the prevalence of Omicron was only 20% (R), so its effect on the number of deaths and hospital resource use has yet to be appreciated. At present, with Delta being the most prevalent variant in our country, the large majority of deaths and intensive care occupation is seen among unvaccinated subjects who are accepted in intensive care units 6.5 times more than vaccinated subjects (Figure 2) and die 5.2 times more frequently (Figure 3). If Omicron is really less dangerous than Delta for unvaccinated subjects, we will see a progressive convergence between the yellow curve and the blue one in both Figure 2 and Figure 3. The plots below will be updated as new data become available.
The equations of this blog post were written using 

Interesting calculation, Paolo – we’ll take a closer look. Regards, Nigel Garrett
LikeLiked by 1 person
Hi, thank you for your comment! I am currently trying to refine this calculation.
LikeLike
Featured in this medical lecture by Mobeen Syed: https://www.youtube.com/watch?v=sokweHgXvr0&t=184s
LikeLike